16% More Conversions from AI-Powered Daily Budget Shifts
Small, daily budget reallocations across 53 apartment communities drove more tours, applications, and chats without increasing monthly ad spend.

The Results

16%
More Conversions, Same Ad Spend
26.2%
Median Lift in Conversions Per Dollar
43%
More Scheduled Tours
The Situation
Competition for qualified renters keeps getting tougher, and the digital ad ecosystem keeps getting more complicated. For most multifamily marketers, the challenge is no longer just showing up online. It's getting more out of the budget they already have.
Most property ad budgets are still set monthly, quarterly, or annually, but renter behavior and competitive pressure change every day. We wanted to know whether that gap was costing properties leads.
So we set out to test whether daily cross-channel budget shifts could improve performance.
Our Hypothesis: Making small, daily, performance-driven budget adjustments can improve ad efficiency and drive better results for apartment communities.
The Solution:
The Budget Optimizer
To test our hypothesis, we built the Budget Optimizer, a decision engine inside CLiQ that treats a property’s ad budget like a high-performance investment portfolio.
Every day, it uses machine learning to evaluate campaign performance using true multitouch attribution and each property's actual market conditions, then moves ad dollars to where they convert best.
Unlike Google’s and Meta’s built-in tools, which can only move budget within their own platforms, the Budget Optimizer moves dollars across channels to wherever they will drive the most conversions.
How it Works
The Budget Optimizer leverages advanced data science techniques to hunt for the highest return on a property’s ad dollars, measured as conversions per dollar (CPD), and automatically shifts budgets to the highest-converting campaigns and channels.
The conversions we tracked against spend:
- Tours Scheduled
- Form Submissions
- Chats Initiated
- Virtual Tours
- Calls from Website
- Get Direction Link Clicks

- Reward models
- Markov chains
- Genetic algorithms
- Hierarchical time-series models

Micro amounts of budget are pulled from many different campaigns to fund high-impact channels.
- We observed a 3-to-1 ratio of budget decreases to budget increases.
- We capped shifts at 20 to 25% to avoid dips in performance within ad platforms.

We knew that to accurately adjust ad spend by channel based on performance, we needed a more sophisticated attribution model and a more accurate way to measure conversion events.
Before we pursued the creation of the Smart Budget Optimizer, we developed a Unified Attribution model that could track longer session windows, deduplicate conversions, and account for impressions and clicks to properly credit channels that were previously undercredited in last-touch attribution models.
The Experiment
We ran a pilot program with 53 properties from February 1 to March 31 to test the Smart Budget Optimizer’s effectiveness with three cohorts in the experiment:
Cohort 1: February 1 to March 31
Cohort 2: March 1 to March 31
Cohort 3: March 15 to March 31
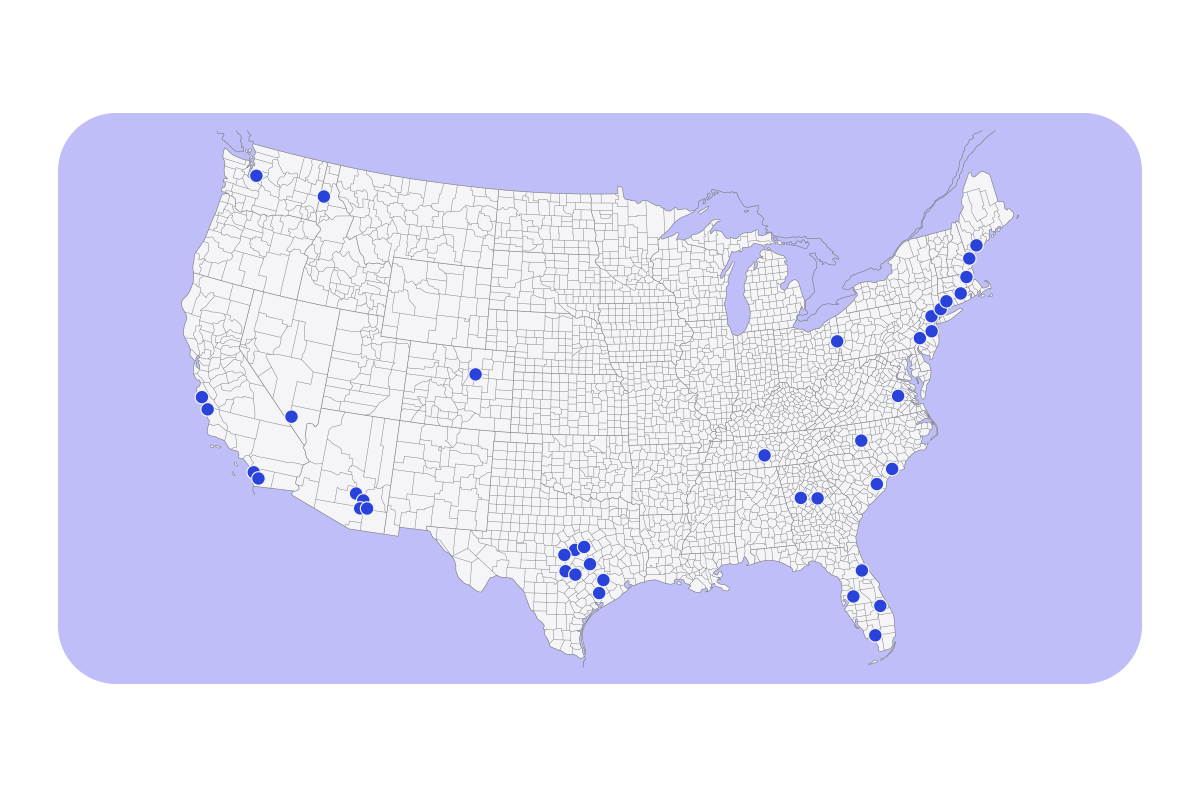
The model made
5,883 budget decisions
across 53 properties
within 60 days.
—
98 avg shifts/day
111 avg shifts/property
To assess whether the pilot was a success, we looked at period-over-period lift in conversions per dollar for each cohort, then measured the overall lift across the entire sample.
We adjusted this lift measurement for seasonality to ensure any increase was due to the model rather than typical leasing activity patterns, and we validated the lifts for statistical significance.
The Results
per Dollar Lift

- 56% Positive lift (31)
- 28.8% Non-significant lift (13)
- 15.2% Negative lift (9)
The properties in the pilot experienced 16% increase in conversions despite per-property ad spend remaining flat.
Highlights:
- 43% increase in Scheduled Tours
- 23% increase in “Apply Now” conversions
- 11% increase in Virtual Tours
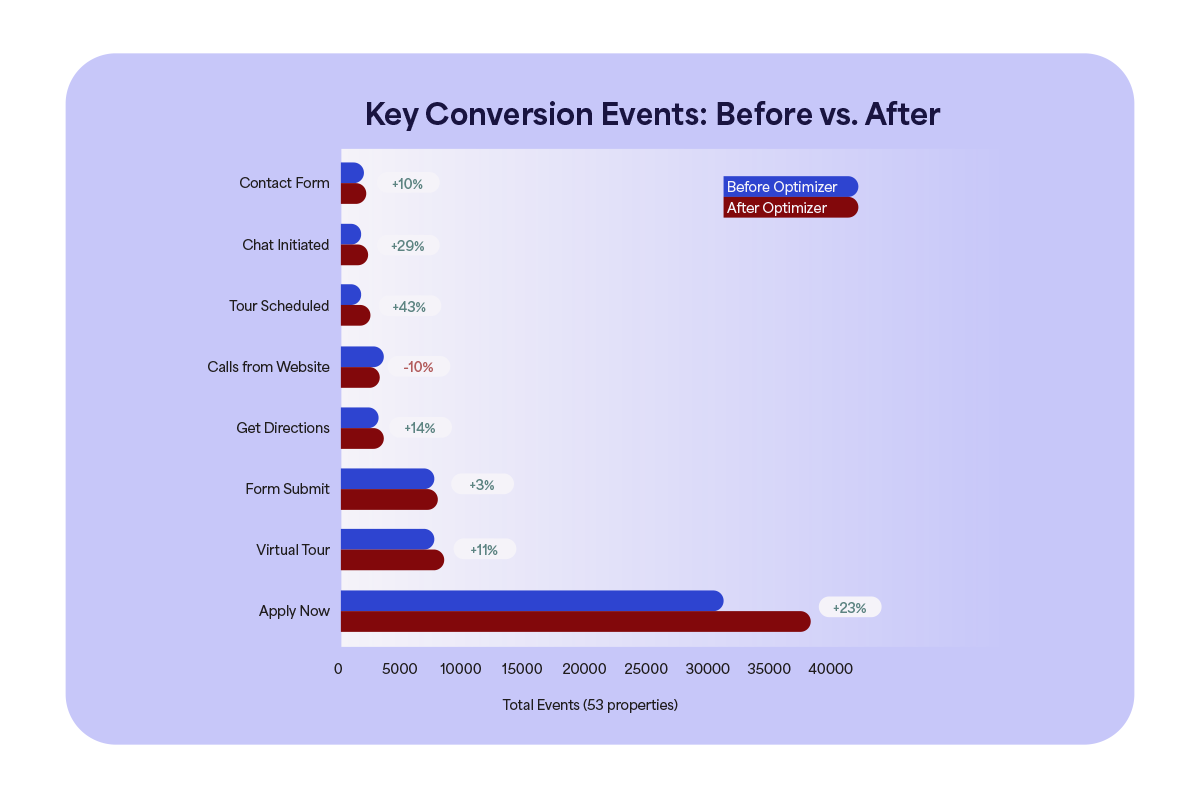
Note: We attributed the decrease in website calls to fewer maintenance requests and other resident questions.
What the Data Revealed
Sustained Daily vs. Monthly Budget Reallocations Can Improve Performance
The cohort that ran the smart budget optimizer for longer performed better. 60% of the properties in Cohort 1 experienced a lift in conversions per dollar vs. 47% of the properties in Cohort 2.
Cohort 1: February 1 - March 31
Cohort 2: March 1 - March 31
Unified Attribution Changes Which Channels Get Credit
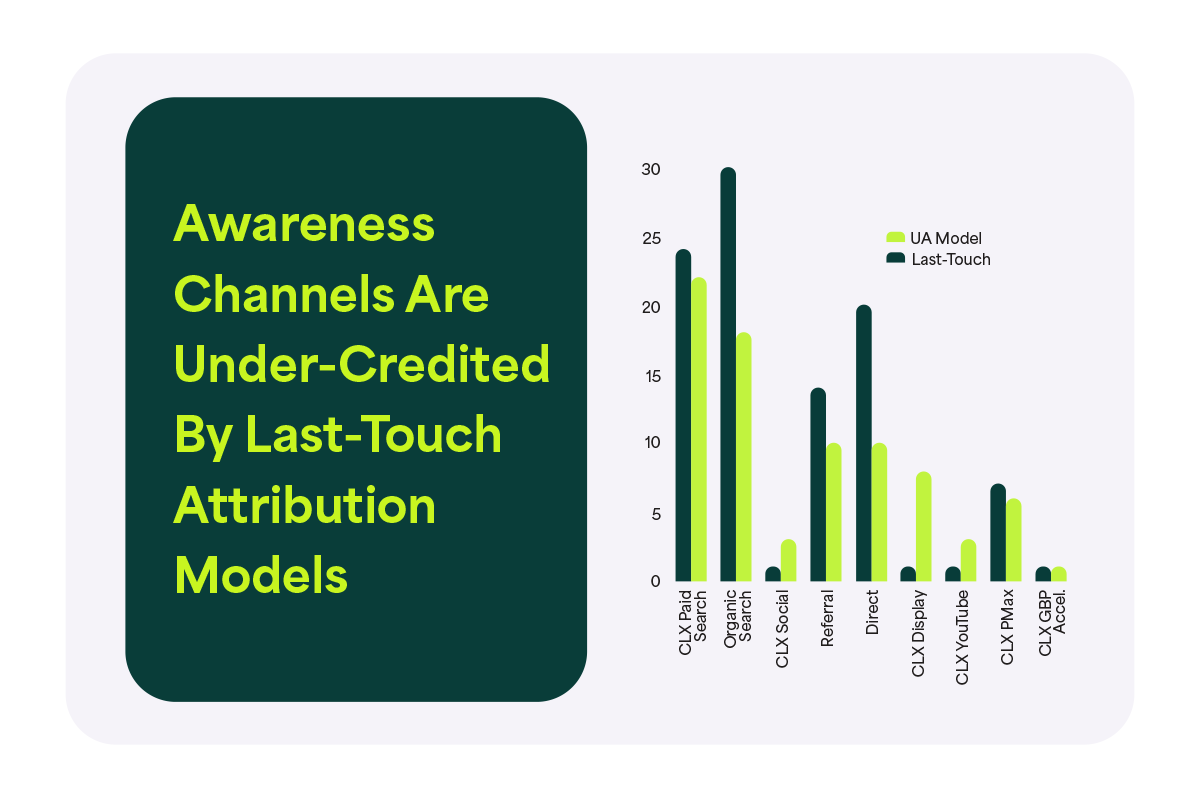
We compared how channels would have been credited across the 53 properties under a last-touch attribution model vs. the new Unified Attribution (UA) model we created, and observed a measurable difference between how channels were credited.
What We Uncovered
Awareness channels are hidden contributors. Last-touch budgets underfund demand creators and overfund demand captors.
- Display is undervalued. Display accounted for for 8% of conversions with UA vs. 1% with last-touch.
- Social assists conversions. Social accounted for for 3% of conversions with UA vs. 1% with last-touch.
- YouTube contributes upstream. YouTube is credited 5% more with UA.
- Organic Search is over-credited. Organic Search is credited 18% compared to 30% with last-touch.
Small, Frequent Shifts Protect Platform Learning
The model pulled small amounts from many campaigns to fund high-impact ones, making about three decreases for every increase. We capped each shift at 20–25%, so ad platform algorithms wouldn't reset and dip in performance.
Daily Optimization Gets Better With Time
The cohort that ran the optimizer longest performed best. 60% of Cohort 1 properties (60 days) saw a lift in conversions per dollar, compared with 47% of Cohort 2 properties (30 days).
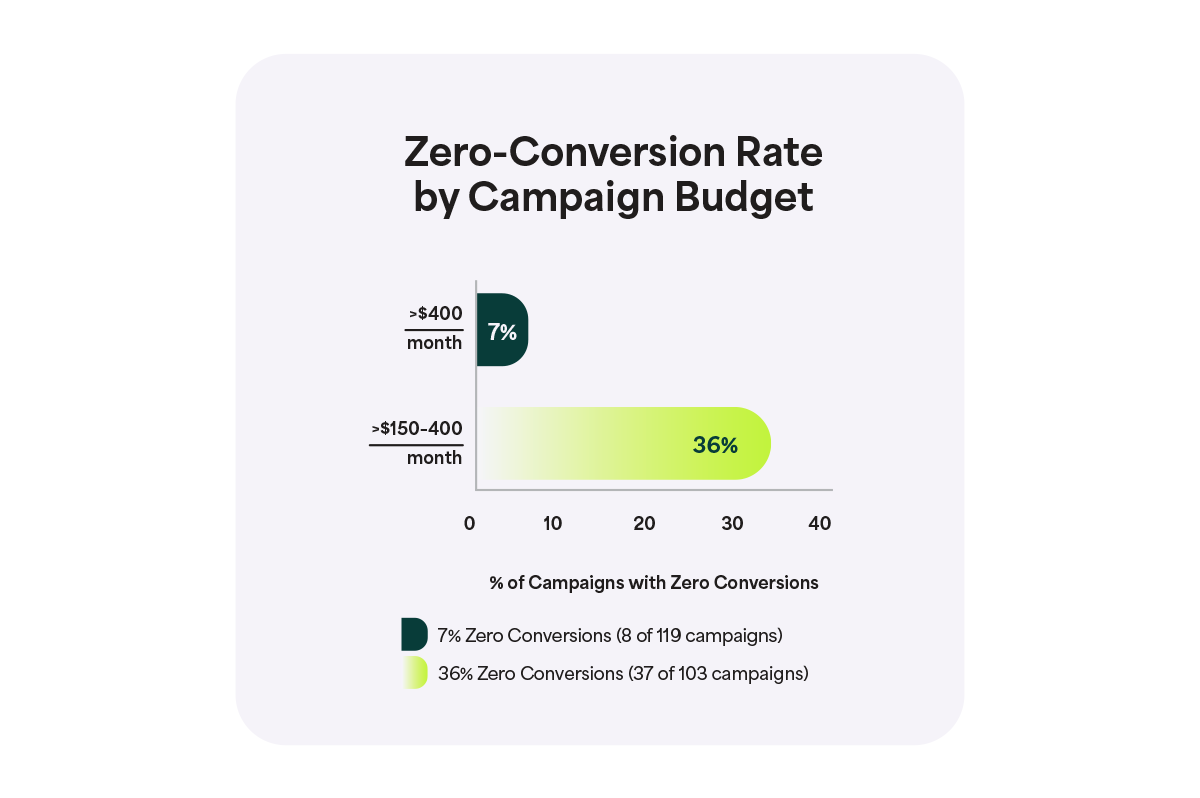
Campaigns Running With Under $400 Tend To See a Higher Failure Rate
Having the proper amount of funding within each campaign type can impact your performance. When we compared campaigns with $150-400/mo budgets to campaigns with $400+, we noticed that 36% of those under $400 had zero conversions compared to only 7% of the campaigns with $400+.
Competitors’ Occupancy, Prices, and Concessions Affect the Efficiency of Your Ad Spend
We measured how CPD differed based on these market factors:
- Starting Rent (1BR/2BR)
- Occupancy
- Comp Avg. Occupancy
- Comp Exposure 30d
- Rent Premium (1BR & 2BR)
- Comp Concession %
Properties with tailwinds (affordable rents, healthy occupancy, soft competitor exposure) realized a lift in CPD more often than those facing headwinds (above-market rents, heavy competitor concessions).
Key Takeaways
1
Modernize Attribution Models
Last-touch attribution overcounts search and undercounts display, social, and video. Budgets built on it underfund the channels that create demand.
2
Optimize Budgets Daily, Not Monthly
Sustained daily reallocations outperform monthly ones when shifts are small enough to respect each platform's algorithm.
3
Avoid Spreading Your Budget Too Thin
Spreading a small budget across too many campaigns raises the risk of lower results. Campaigns with less than $400 allocated to them are more likely to underperform.
More case studies