Uncovering Your Prospects’ Website Journey: Part 2 Lead Flow
- 3 June 2019

In the first part of this two-part series, we showed you how to track the path that website visitors take when they visit your site in Google Analytics. In part two, we will show you how to track the path prospects take before taking lead generating actions on your website. We will explore the “Conversions” section in Google Analytics, cover the most relevant reports for understanding your lead flow, and help you interpret your results.
Goals in Google Analytics
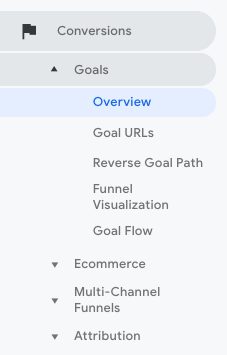
The best place to start analyzing your lead data is the “Goals” section under “Conversions” in Google Analytics. This is where you will find the number of leads generated from your site, where they converted, and what marketing channels brought in the leads. The first report you want to open in this section is the “Overview” report.
In this report, you will find the total number of Goal Completions that occurred in a given time period, an overall Goal conversion rate and a breakdown of Goal completions by Goal type. Most communities set up Goals for actions like phone calls, contact form submissions and apply now button clicks. In the example below we track additional Goal Completions from actions taken on our two Conversion Cloud products, Schedule Genie and Concession Manager.
To isolate a given Goal type as you analyze these reports, select your Goal Option in the upper left hand side.
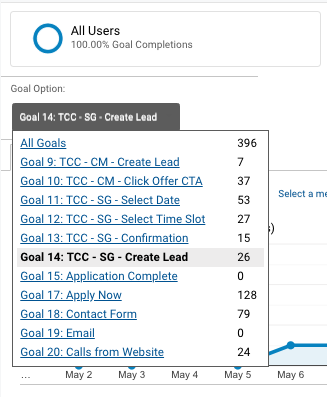
To get the most out of your analysis, you’ll want to select the Goal types that are the most linked with lead generating actions. While at first glance it may appear that Apply Now and Application Complete are the closest actions to a lease, but these two Goals aren’t often good indicators of leads or leases on apartment websites. Apply now is often an overinflated metric and Application Complete is often underinflated. Many applications are filled out onsite and apply now clicks represent people looking for information about the application process that aren’t really interested in submitting an application. If you have a tour scheduler on your website, looking at leads who booked tours will likely be the best conversion for you to perform an analysis on. In the example above, we selected the Create Lead Goal from Schedule Genie, which is a step in the tour scheduling process where the prospect submits their contact information for their tour.
Below the breakdown of Goals Completions by type is a list view with the top marketing sources and mediums that Google attributes to your Goal Completions. If you limit your view of the Overview page to a single Goal type, the data in this part of the report will be limited to the source data relevant for that Goal type.
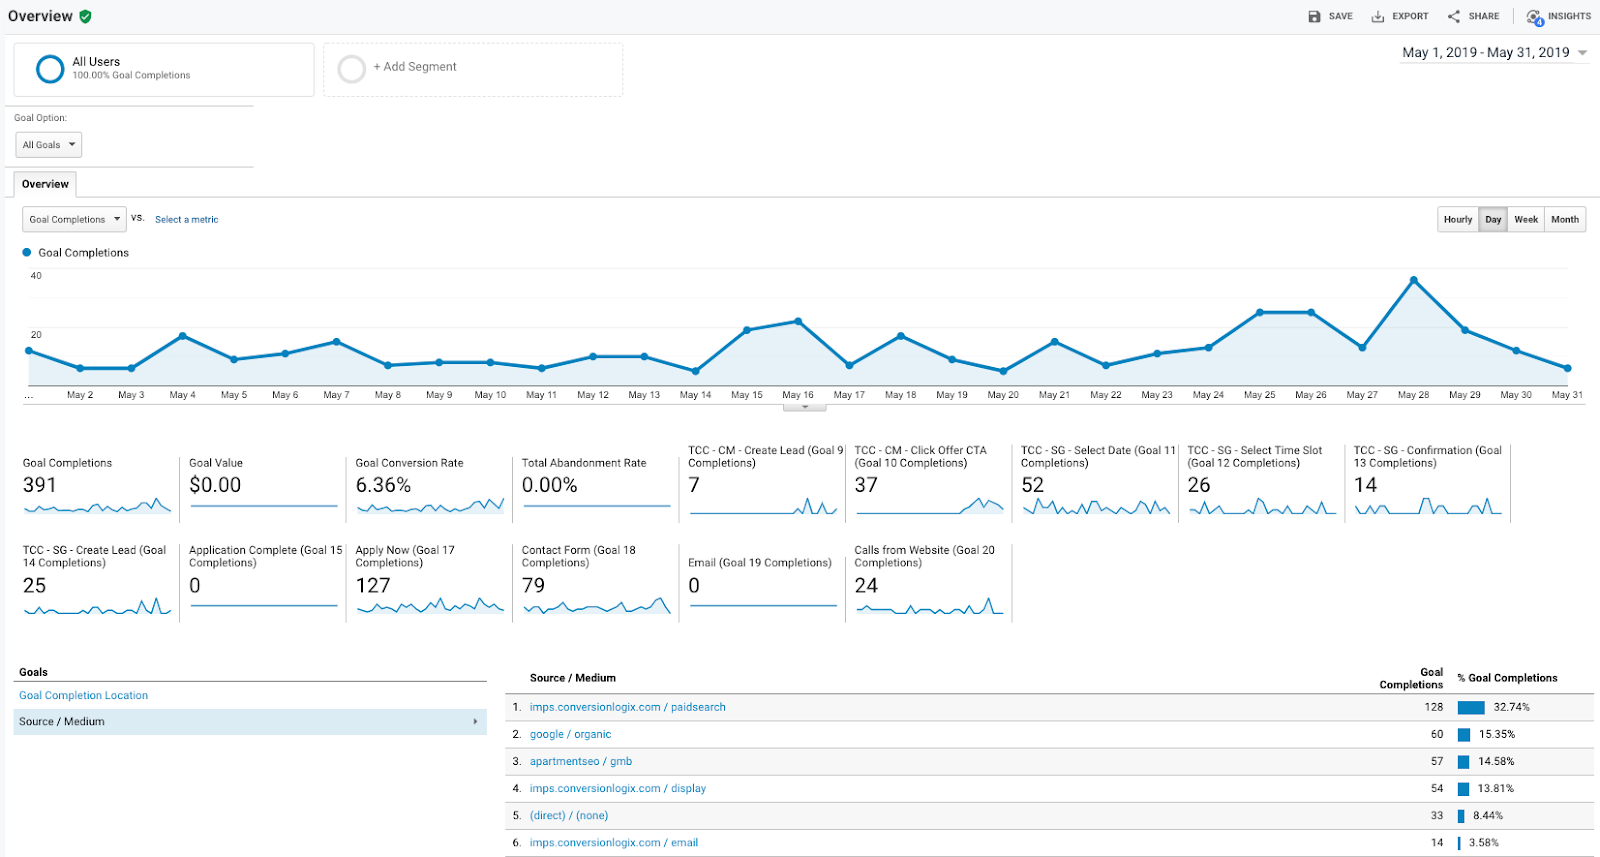
By default, Google uses the Last Non-Direct Click attribution model when measuring and reporting on Goal Completions. This means that the last marketing channel that a lead comes in from (not including direct sources) will get all the credit for a conversion in this report.
Direct traffic sources appear when Google can’t attribute the true traffic source or if the only source present is a direct entrance to the website.
If you want to explore other attribution models outside of the default Last Non-Direct Click model, go to the “Model Comparison Tool” under “Attribution” in the “Conversions” section. There you can compare how many conversions are attributed to a given source if you use a different attribution mode. Some examples of these include the First Interaction Model, Position-Based Model or Time Decay, among others. To learn more about what these different attribution models do check out this resource from Google.
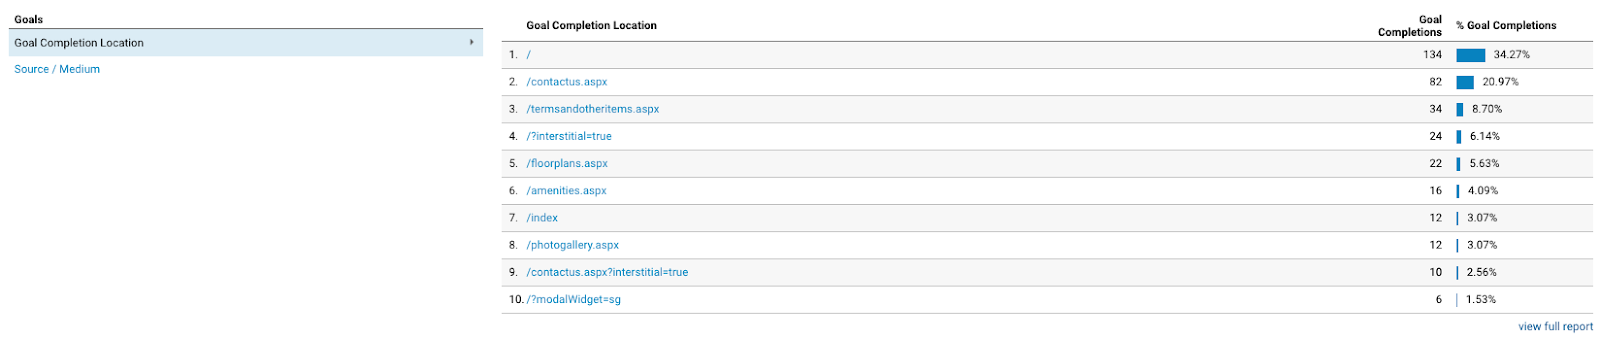
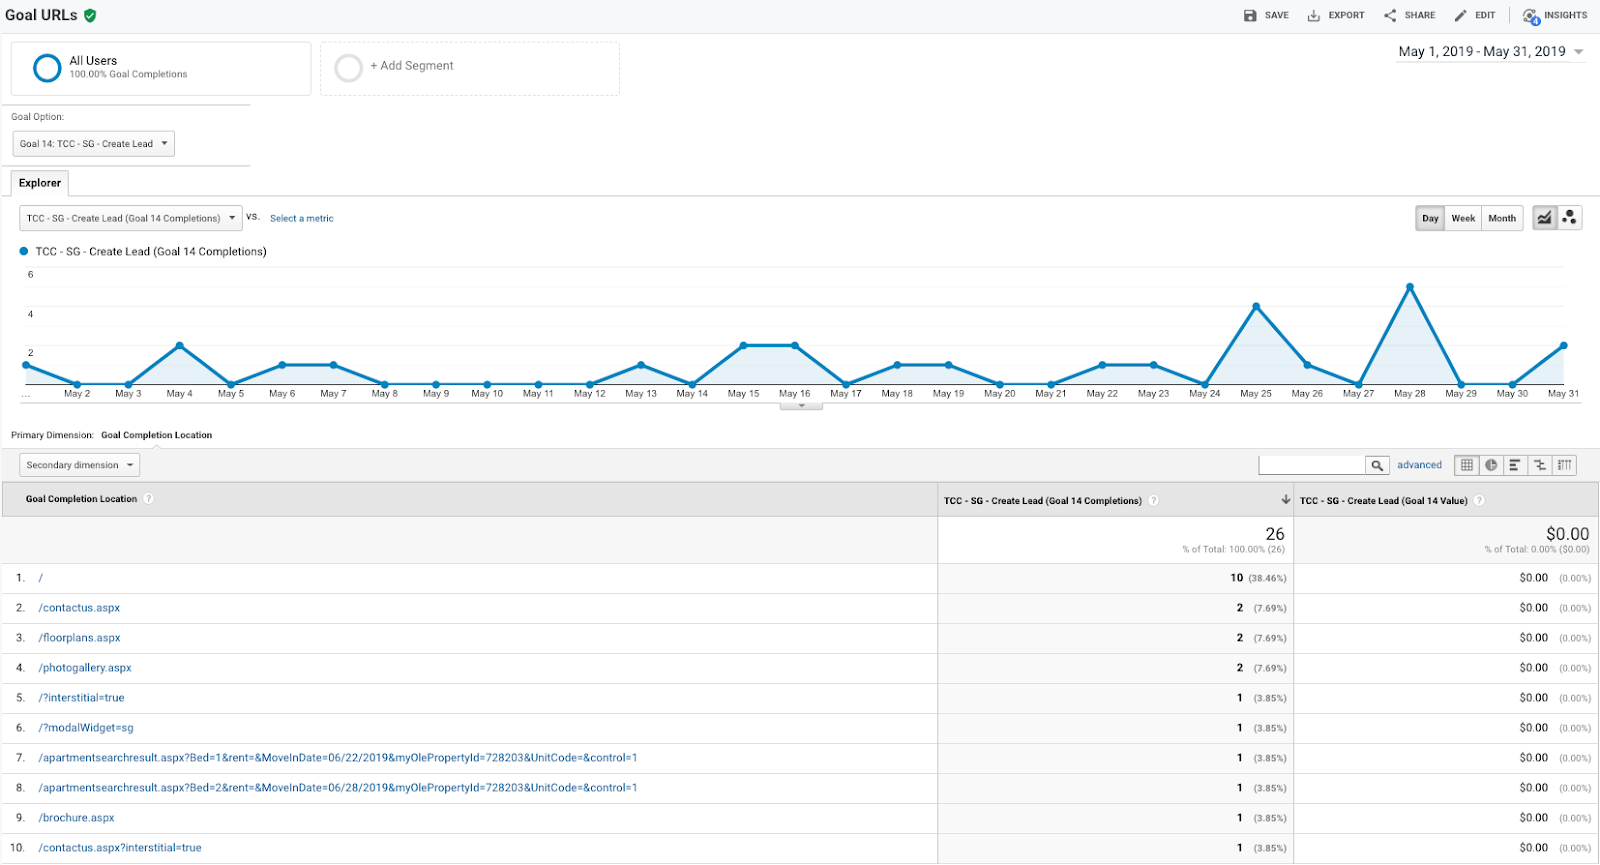
You can toggle between Source/Medium and Goal Completion Location within the list view. If you select Goal Completion Location, Google will show you the pages where the goal completions took place.
For a more in-depth report, visit the Goal URLs page.
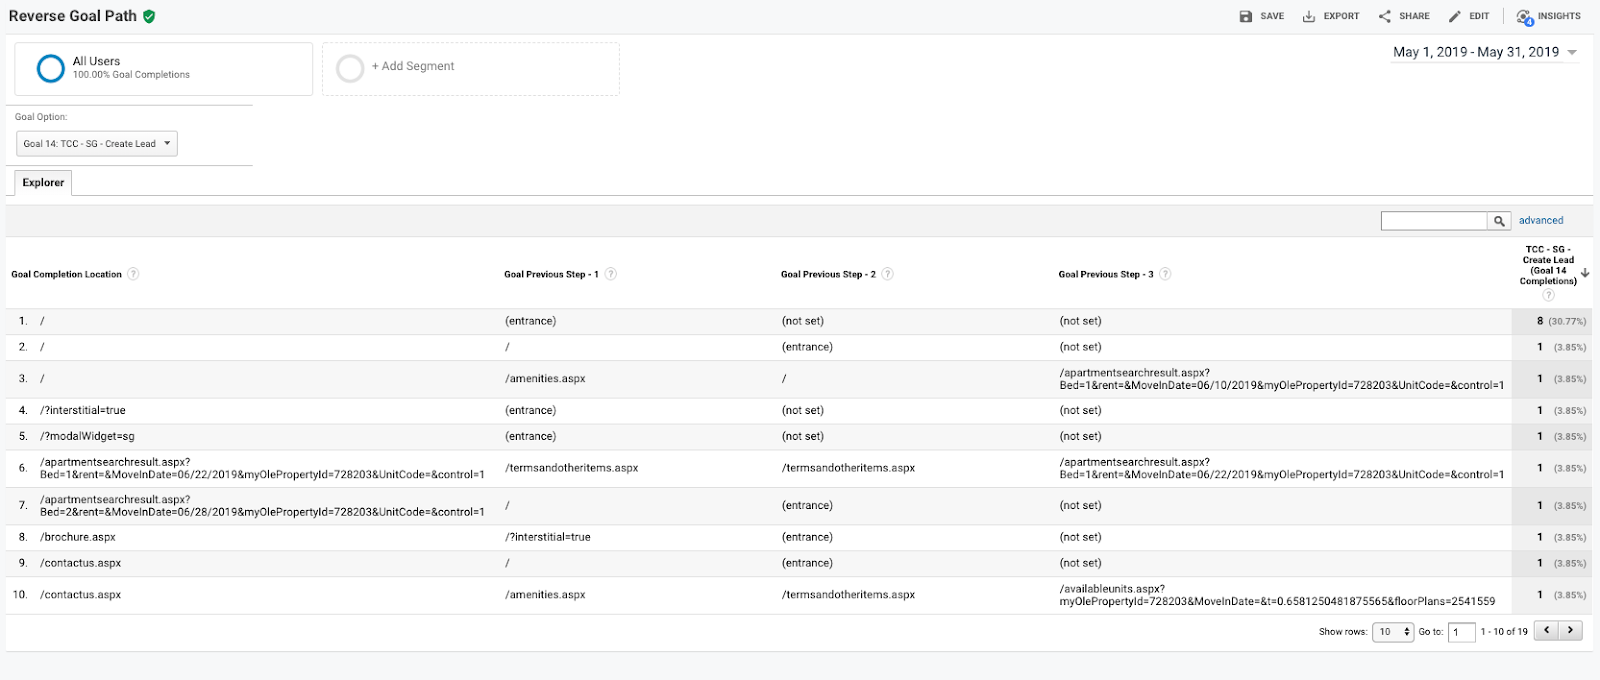
To get an idea of the pages that leads came in from before converting on a given webpage, check out the Reverse Goal Path report.
How long does the typical prospect take to become a lead?
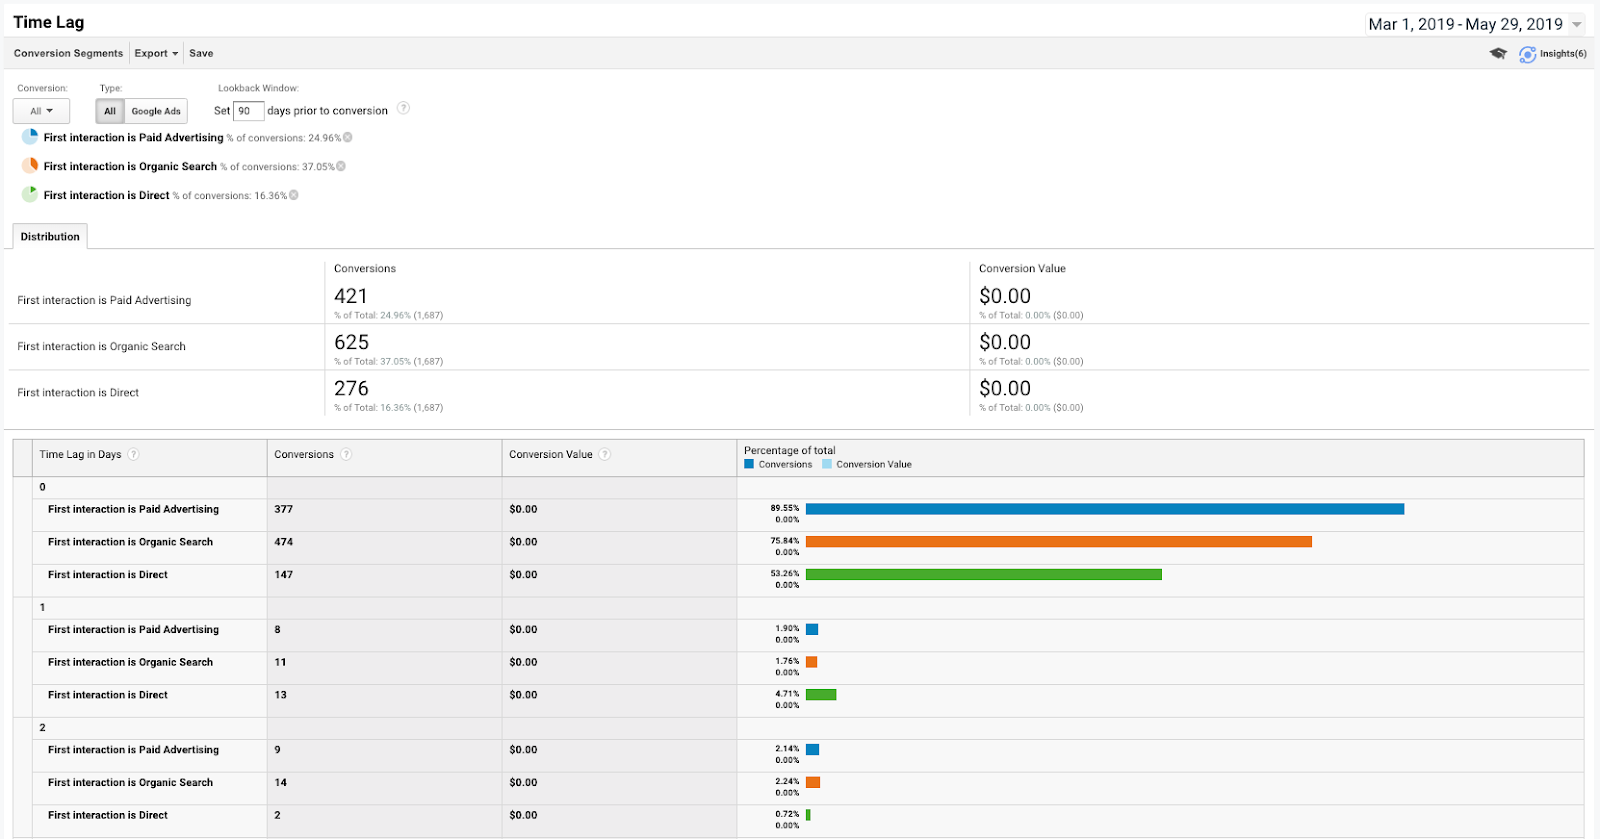
Within the Conversions section in Analytics, under “Multi-Channel Funnels” is a report called “Time Lag” where you can find out how many days took place between the first interaction users had on your website and the day they made a conversion.
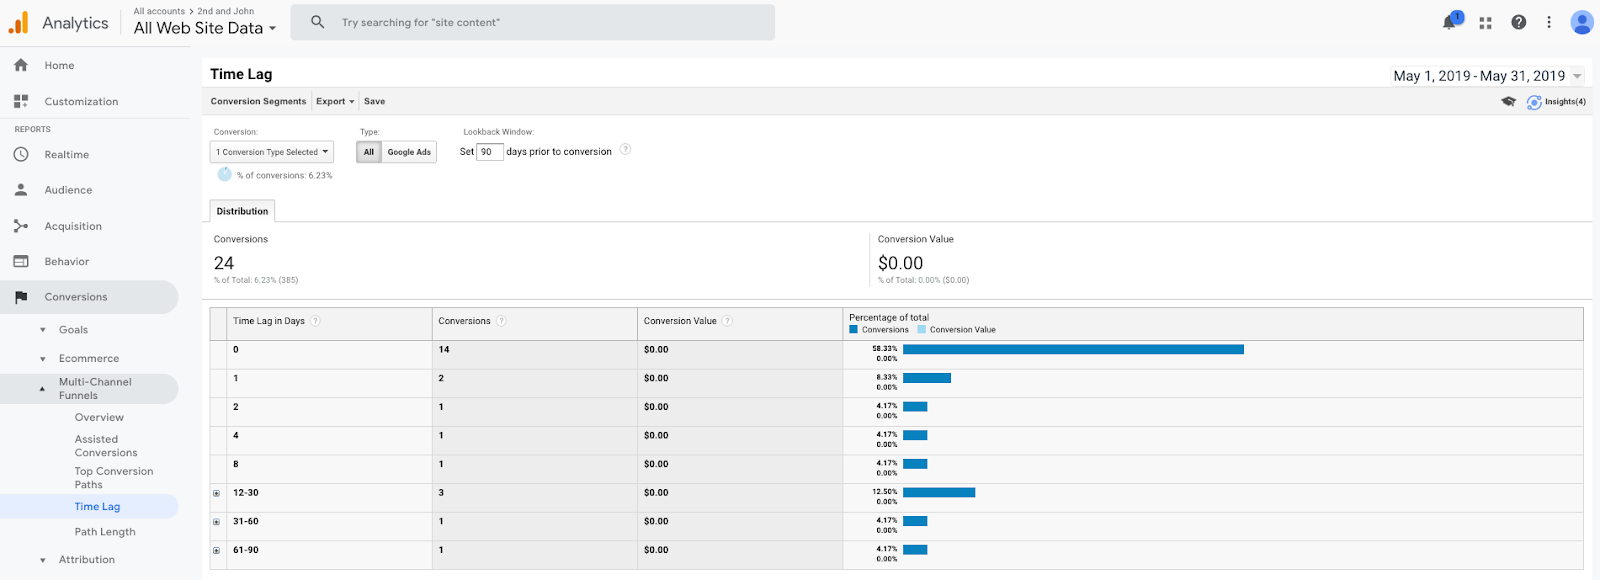
In this example we looked at the time it took for leads that scheduled a tour in the month of May to convert. Most conversions occurred within the day of the first visit, but three leads came back to the site 2-4 weeks later to schedule a tour, and one tour was scheduled two to three months after the lead first visited the website. This just goes to show how varied the apartment search process between individuals can be and why communities should evaluate their marketing performance using longer attribution windows.
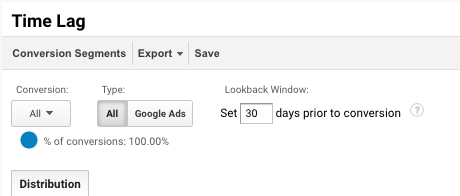
Within this report, and others in the Conversions section in Analytics, Google lets you select a lookback window. This is the period of time that Google tracks user activity before a conversion.
By default, Google selects 30 days. While many online conversions occur within a day or two of a website visit, there are still prospects who spend months in the searching phase and come back to a community website over a longer span of time before they convert, which is why you’ll want to select a 90 day look back window (the longest period Google lets you select).
You can drill down on the Time Lag report by paid, organic, and direct traffic sources to compare the length of time it takes for paid and organic traffic to convert. You might want to select a longer attribution window when making these comparisons in order to get enough data.
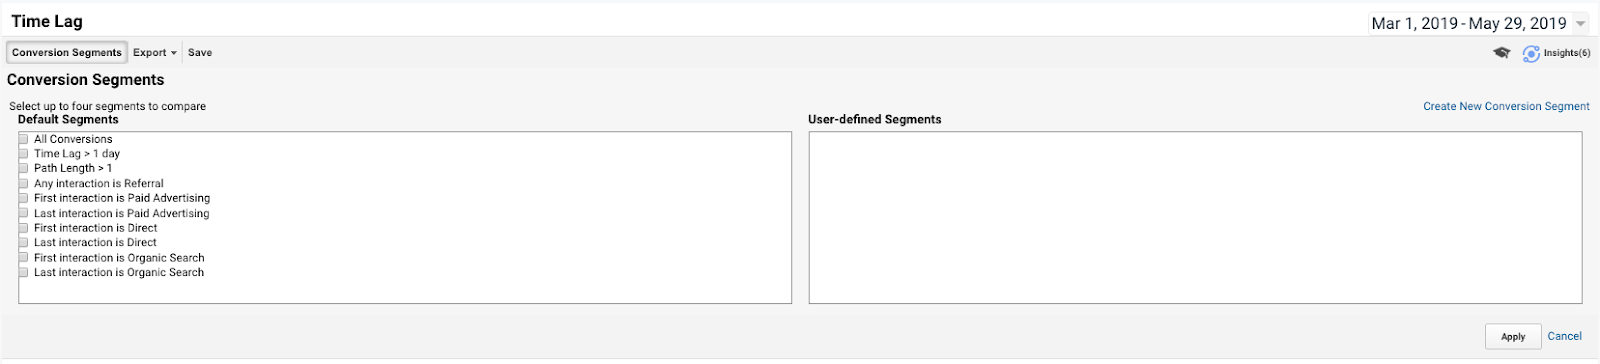
To make time lag comparisons between marketing sources, click on “Conversion Segments” in the upper left hand corner of the report and select between the comparison options available.
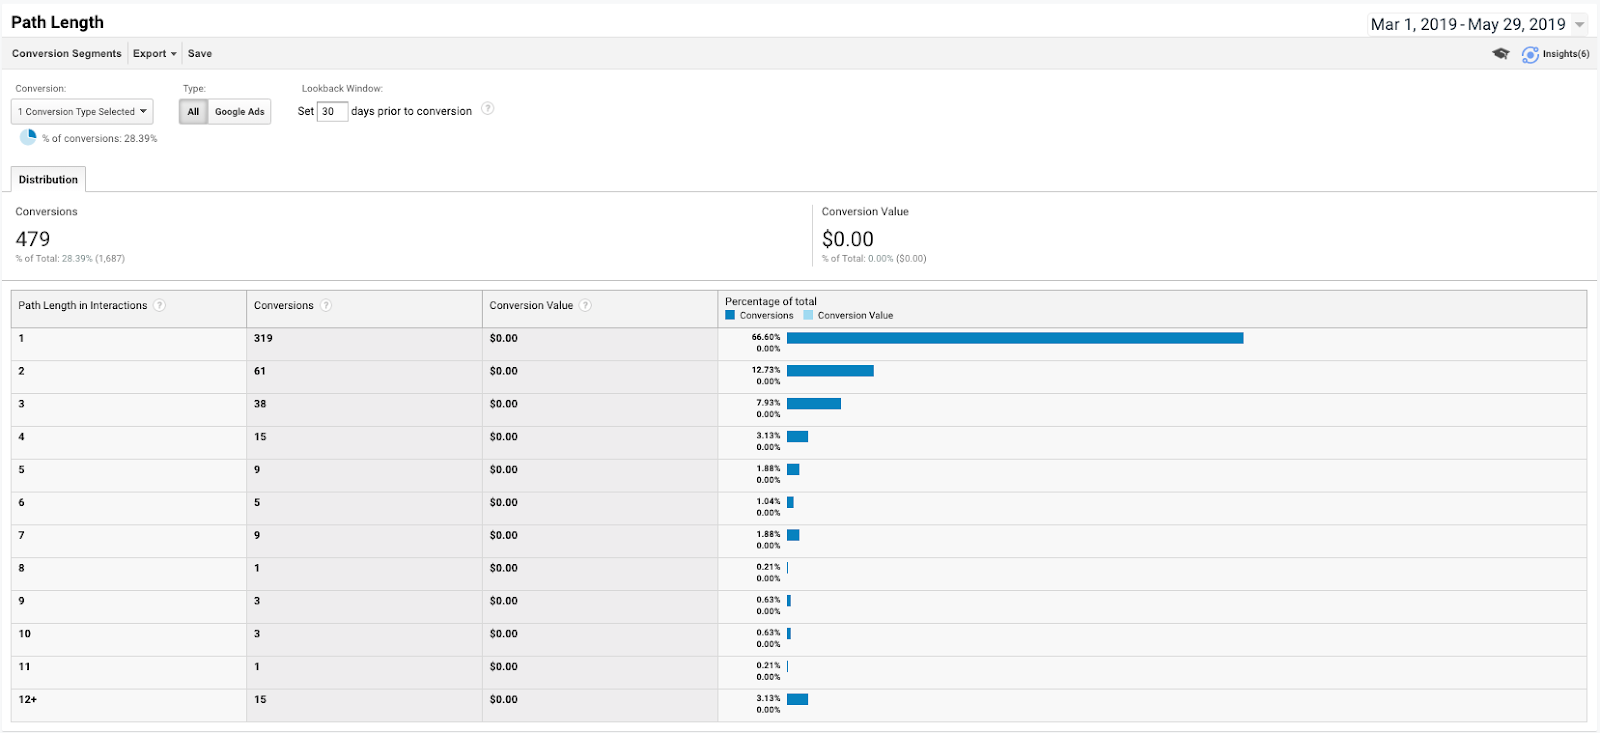
How many website visits does a typical website visitor make before they convert?
You can find this in the “Path Length” report under “Multi-Channel Funnels”. This report shows you how many times a prospect came to your website before becoming a lead. Most conversions take place within a single website session but come back and forth to the site before making the decision to connect with the community.
How many marketing channels contribute to a conversion?
To get a better idea of how different marketing channels work together to convert a website visitor into a lead you can look at the “Top Conversion Paths” report.
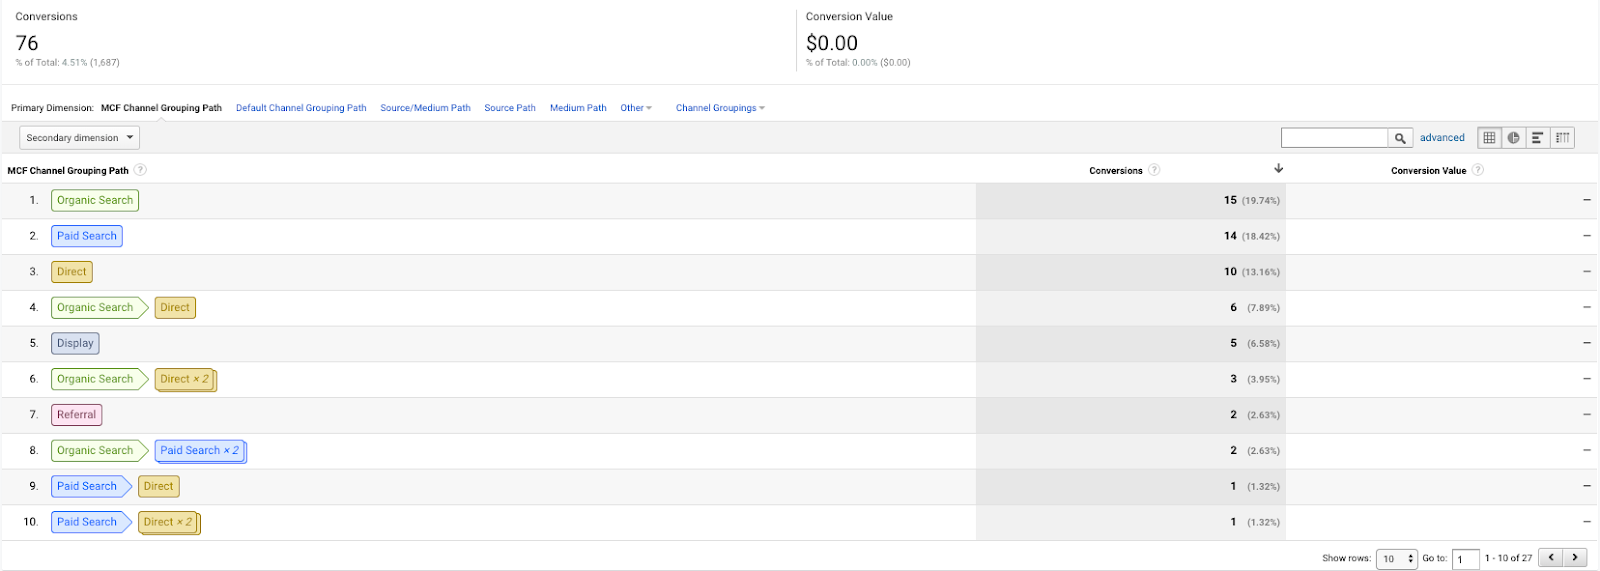
This report shows you how many leads convert through paths that involved multiple marketing sources and in which order they engaged with your marketing campaigns before becoming a lead. Within indirect paths, it isn’t uncommon to see a combination of paid and organic journeys where website visitors come in to a website initially from an ad and then later through an organic or direct search.
It’s important to note that if a prospect sees an ad, email or social media post and doesn’t click into your website, then comes back later through another marketing channel, the original marketing efforts won’t be tracked by Google Analytics. When these prospects come back to your website later through another source, that source will be given the credit for the conversion. This traffic is often lumped in with organic and direct sources.
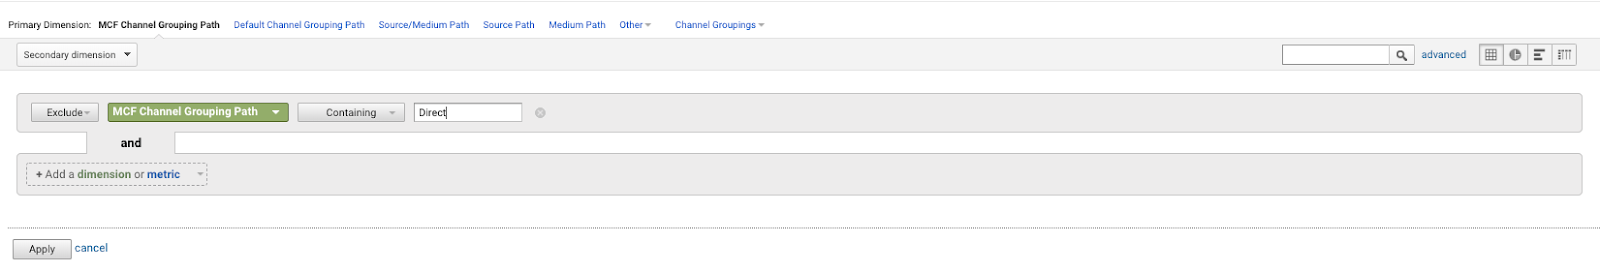
Since Google often attributes unknown traffic sources as direct traffic you might want to filter this source out when you analyze this report. You can do this by selecting the “advanced” and setting up a filter.

Select “Exclude” and then type in “Direct” and click “Apply” to filter out this traffic.
This will help you narrow in on more interesting conversion paths and give you better intelligence to make optimization insights with.
How to Apply This Data
So far we’ve learned where to go to see the number of conversion that took place on your site, the types of conversions that occurred, the pages they occured on, what marketing channels contributed to the conversion process and how many days it took a prospect to take a converting action.
Here’s how these new tools can help you assess and improve your marketing efforts.
By comparing the types of Goals that get the most engagement you can gain insight into where your leads are in the leasing process and how many leads you have coming down the pipeline. If they call you or fill out a contact form, they are likely interested in seeking out more information about your community. If they schedule a tour or redeem an offer on your website, they are showing a greater interest in coming in person or moving further down the leasing funnel.
Your marketing source data and your top conversion paths give you an idea of the types of marketing efforts that are effective at moving leads through the funnel. The marketing channels that played the greatest role in generating traffic that converts are the ones you want to optimize for or make greater investments in when you need to generate more leads. When you make modifications to your campaigns, you can track the success of your changes by how many conversions these marketing channels helped generate. By looking at a holistic view of your conversion paths you give more credit to marketing channels that often get left out of the attribution picture.
Schedule a Call